
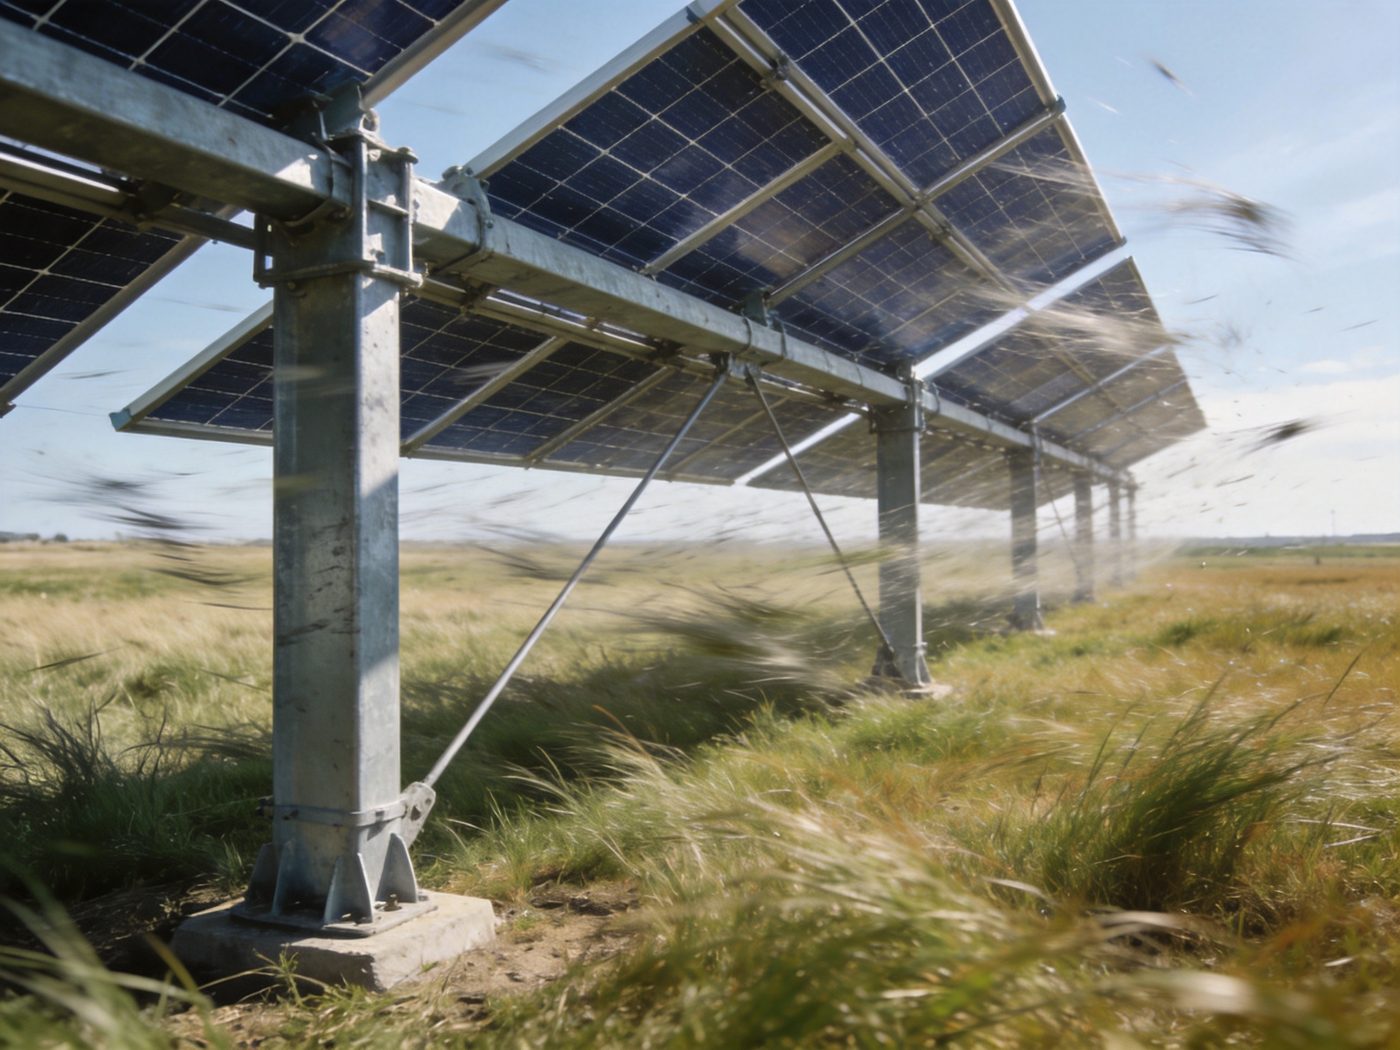
Wind load governs the structural design of solar mounting systems in the majority of ground-mounted and tracker installations worldwide — exceeding snow, seismic, and gravity load as the controlling demand case in all low-snow, open-terrain, and coastal deployment environments. Uplift pressure on inclined panel arrays acts perpendicular to the panel surface and is not offset by self-weight at tilt angles below 30°, creating net uplift forces at pile heads that are 2–4× the structural dead load the piles are designed to carry in compression. A single-row tracker bay at 40 m row length under a 140 mph design wind event in ASCE 7 Exposure C generates net uplift demand at each pile position of 35–65 kN — against a structural dead load of 8–12 kN — meaning the pile embedment, not the above-grade steel section, is the critical load-path element, and undersizing it produces sudden foundation failure rather than the gradual yielding that visual inspection could detect. This wind load engineering guide is part of our comprehensive Solar Mounting Materials & Structural Engineering Guide — covering the complete design chain from wind pressure calculation through section design, connection specification, foundation selection, and regional code compliance.
Wind resistance is one of the most critical factors in solar mounting structural safety and long-term reliability — and wind load specification errors are the most common cause of structural permit rejection and the most consequential cause of catastrophic structural failure in utility-scale solar installations where design assumptions were not verified against site-specific wind data.
Technical Snapshot: Wind Design Parameters for Solar Mounting Structures
| Parameter | Typical Value Range | Governing Standard | Engineering Note |
|---|---|---|---|
| Design Wind Speed (Vult) | 110–165 mph (175–265 km/h) U.S. utility-scale | ASCE 7-22 Fig. 26.5-1D (Risk Cat. II) | 3-second gust speed; varies significantly by location and risk category |
| Velocity Pressure (qh) | 15–40 psf (0.72–1.92 kPa) at panel height | ASCE 7-22 Eq. 26.10-1 | Scales with V²; 10% speed increase = 21% pressure increase |
| Net Pressure Coefficient (CN / G·Cf) | 0.8–1.5 (uplift-dominant at 10–35° tilt) | ASCE 7-22 Fig. 29.4-7 (ground-mount) | Tilt angle and array edge proximity govern CN selection |
| Load Type | Net uplift + lateral; reversal under oblique wind | ASCE 7-22 Chapters 26–29 | Uplift typically governs pile tension; lateral governs bracing design |
| Design Life Base Wind | 700-yr MRI (Risk Category II structures) | ASCE 7-22 Section 1.5.1 | Solar mounting = Risk Category II (standard occupancy) per ASCE 7-22 |
Screen the entered wind and snow assumptions
Use the transparent pre-check to organize project inputs and see the resulting pressures and tributary forces. It does not replace the governing code procedure or project-specific structural design.
Engineering Context
Why Wind Governs Solar Structural Failure
Solar mounting structures fail under wind through three mechanically distinct load paths, each requiring independent structural verification. First, global uplift at pile foundations — the net vertical component of wind pressure on the panel array acts upward on the pile head, placing the embedded pile shaft in tension against the surrounding soil; in loose granular soils or short embedment depths, this produces sudden pile extraction with no advance warning. Second, overturning moment at column base connections — wind lateral force on the panel area creates a bending moment at the column-to-rail and column-to-pile connection that must be resisted by the connection hardware; if the column base plate or pile head weld fails, the entire structural bay collapses laterally within the wind event. Third, torsional instability of tracker rows — tracker torque tubes with insufficient torsional stiffness (GJ) rotate under wind pressure asymmetry between upwind and downwind panel edges, causing the tracker row to flutter at a resonant frequency that amplifies dynamic wind loads above the static design pressure by factors of 1.5–2.5× in documented field events. All three failure modes are preventable through correct structural design — including the bracing geometry and member section specification covered in the structural bracing strategies resource, which provides the lateral bracing design methodology that resists overturning and torsional wind instability in solar mounting frames.
Why Trackers Are More Sensitive to Wind Than Fixed Tilt
Fixed-tilt solar mounting structures present a constant aerodynamic geometry to the wind at a fixed angle — allowing wind load to be calculated once for the governing tilt and orientation and confirmed against a static structural model. Single-axis trackers present a variable aerodynamic geometry that changes with rotation angle throughout every day and under every wind event — creating three distinct structural wind load cases that must all be verified: the tracking position (0°–55° tilt) under normal operation, the stow position (typically 5° tilt or horizontal) during design wind events when the tracker controller orients panels to minimize wind exposure, and the fault-stow position (any angle) for the case where the tracker fails to reach stow before the design wind arrives. At high tilt angles outside the normal tracking range — which can occur under controller fault conditions — wind pressure coefficients increase by 40–80% over the horizontal-panel case, and the torque tube torsional demand may exceed the drive system’s resistance. The complete structural engineering specification for tracker systems under wind — including stow strategy, torsional stiffness requirements by row length, and damper specifications for dynamic wind response — is covered in the single-axis tracking systems resource.
Engineering Fundamentals
Wind Pressure Formula: Velocity Pressure and Design Pressure
The fundamental wind pressure calculation chain under ASCE 7-22 begins with velocity pressure at the reference height of the structure:
\[ q_h = 0.00256 \times K_z \times K_{zt} \times K_e \times K_d \times V^2 \quad \text{(psf, V in mph)} \]
In SI units (Pa, V in m/s):
\[ q_h = 0.613 \times K_z \times K_{zt} \times K_e \times K_d \times V^2 \]
where: Kz = velocity pressure exposure coefficient (function of height h and exposure category; for ground-mount arrays at h = 3–5 m in Exposure C: Kz ≈ 0.70–0.85); Kzt = topographic factor (1.0 for flat terrain; up to 1.8 at hilltops and escarpments per ASCE 7-22 Section 26.8); Ke = ground elevation factor (1.0 at sea level; reduces to 0.94 at 1,000 m elevation per ASCE 7-22 Table 26.9-1); Kd = wind directionality factor (0.85 for all open-structure solar arrays per ASCE 7-22 Table 26.6-1); V = design wind speed (3-second gust, mph or m/s), from ASCE 7-22 Figure 26.5-1D for Risk Category II structures. The design wind pressure on the solar panel array is then:
\[ p = q_h \times G \times C_N \]
where G = gust factor (0.85 for rigid structures); CN = net pressure coefficient from ASCE 7-22 Figure 29.4-7 for ground-mount fixed-tilt arrays (negative = uplift; values range from −1.5 at array edges to −0.8 at interior panels for 20–30° tilt in clear wind flow). ASCE 7-22 Section 29.4.5, introduced in the 2022 edition, provides the first dedicated ground-mount calculation procedure in ASCE 7 history — replacing the previous practice of adapting open-building monoslope roof provisions that were not validated against ground-mount wind tunnel data.
Uplift Force Calculation: From Pressure to Pile Head Demand
Net uplift force at each pile head is calculated by summing wind pressure over the tributary area of panels supported by each pile, applying the governing combination of uplift pressure (normal to panel surface) and self-weight (vertical downward):
\[ F_{\text{uplift}} = p_{\text{net}} \times A_{\text{trib}} \times \cos\theta – W_{\text{DL}} \]
where pnet = design uplift pressure (kPa or psf); Atrib = tributary panel area per pile (m² or ft²); θ = panel tilt angle; WDL = dead load (self-weight) of panels and structure tributary to pile (kN or kips). For a representative utility-scale fixed-tilt row at 25° tilt, 2 × 2 m panels, 2.5 m post spacing, and design wind pressure of 1.44 kPa (30 psf): Fuplift = 1.44 × (2.0 × 2.5) × cos(25°) − 1.2 = 6.53 − 1.2 = 5.33 kN per pile under LRFD factored loads. At 140 mph Vult in Exposure C, factored uplift can reach 15–25 kN per pile at edge-of-array locations where CN reaches −1.5 — more than 10× the pile’s tributary dead load resistance. Load path continuity from panel to pile head through all structural connections is the governing design verification chain described in the material thickness and strength resource, which quantifies how section dimensions at each member in the load path govern the capacity available to resist wind-induced demand.
Load Path Through Solar Mounting Structures
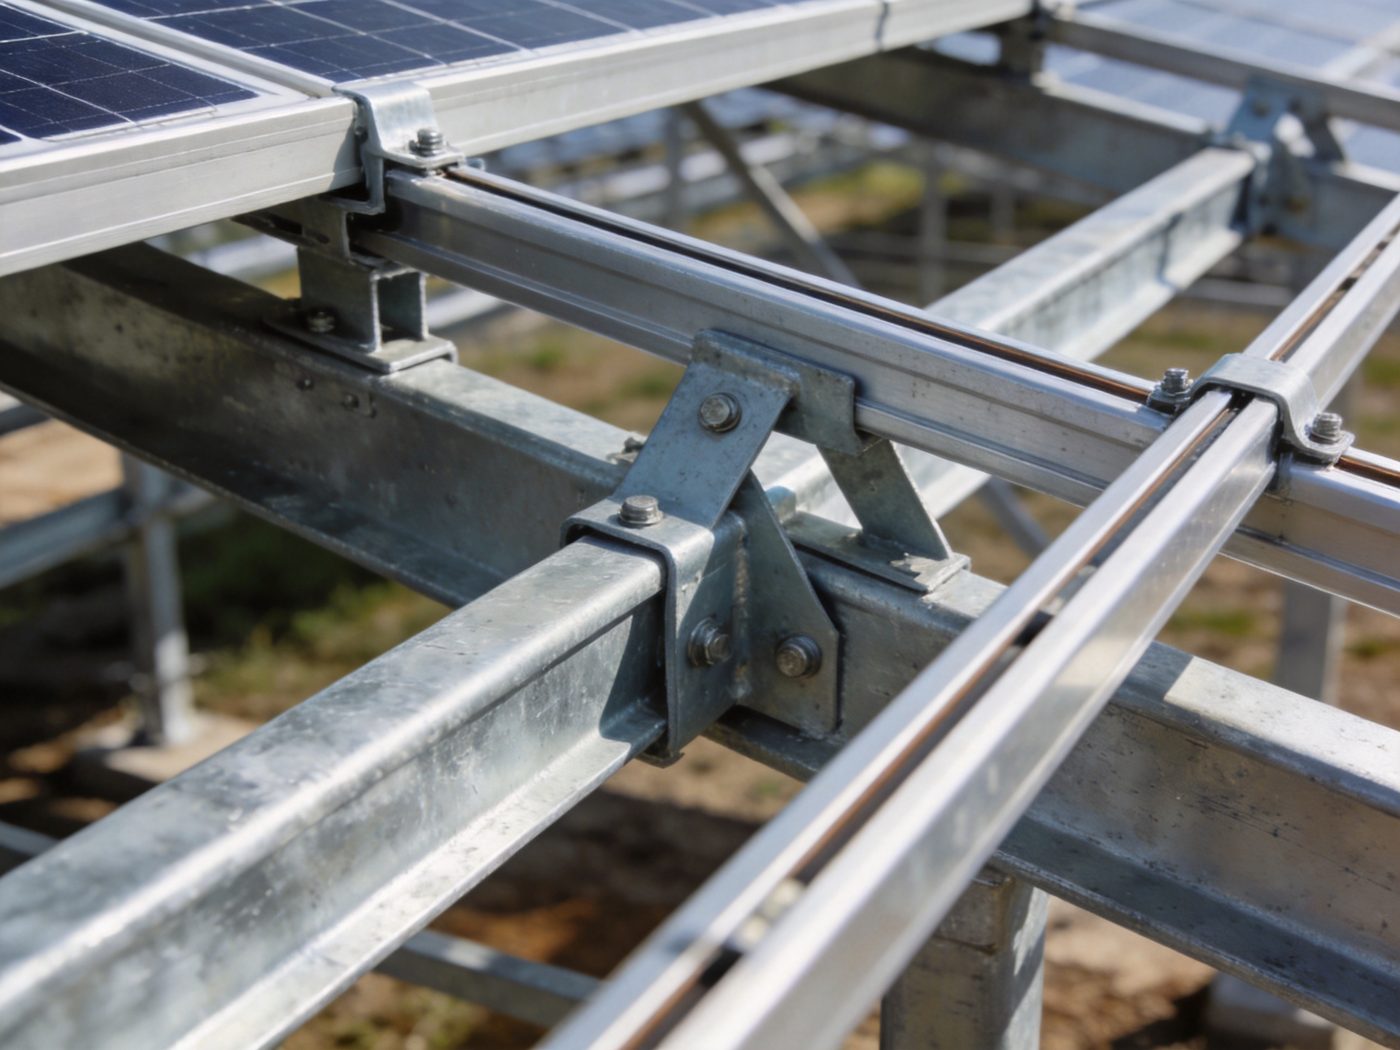
Wind pressure on panel surfaces transmits through a defined structural load path: panel frame → module clamp → rail → column → pile head connection → pile shaft → soil resistance. Structural adequacy must be verified at every link in this chain — a pile embedment designed for 20 kN uplift capacity is structurally irrelevant if the rail-to-column connection fails at 12 kN due to an undersized through-bolt or thin rail flange. The critical engineering principle is that the weakest link governs: overall system wind resistance equals the minimum single-member or connection resistance in the uplift load path, not the average. The specific section dimensions that govern capacity at each member in the load path — and the interaction between corrosion-induced section loss and wind resistance over the design life — are quantified in the material thickness and strength considerations resource.
Section Modulus in Wind Bending Design
Rail and column members in the wind load path resist bending moments as well as axial forces — the distributed wind lateral pressure on the above-grade structure creates bending demand at the column base that must be resisted by the section modulus (Z) of the column cross-section. For tall tracker posts (h ≥ 1.5 m) at high wind speeds, lateral bending demand at the column base may govern section thickness specification above and beyond the deflection-governed rail design. The interaction between post height, span, and section requirement in long-span applications is developed in the long span structural design resource.


Design Standards & Cross-Reference
Three primary standards govern wind load specification for solar mounting structures across global markets. ASCE 7-22 (Minimum Design Loads and Associated Criteria for Buildings and Other Structures) is the definitive U.S. standard — adopted by IBC 2024 and required for permit submissions in all U.S. jurisdictions. The 2022 edition introduced Section 29.4.5 (fixed-tilt ground-mount PV systems) and Section 29.9 (tracker arrays), providing the first wind tunnel data-validated calculation procedures specifically for solar mounting structures; previous permit submissions used the open building monoslope roof provisions of Chapter 27, which were not geometrically calibrated to ground-mount solar array configurations. EN 1991-1-4:2005 (Eurocode 1: Actions on Structures — Wind Actions) is the governing standard for solar mounting structural wind design in EU and international markets — using a different velocity pressure formulation (qp(z) = ce(z) × qb, where qb = 0.5 × ρ × vb²) but fundamentally identical physics; site-specific basic wind velocity vb is extracted from National Annex wind maps by country. IBC 2024 (International Building Code) adopts ASCE 7-22 by reference for all wind load provisions and adds the AHJ (Authority Having Jurisdiction) compliance framework that governs what documentation — wind speed maps, exposure category justification, calculation methodology — must appear in a permit submittal for structural acceptance.
Wind Speed Maps and Exposure Categories
ASCE 7-22 defines four exposure categories based on the upwind surface roughness within a 1.6 km (1-mile) radius of the structure, evaluated independently for each wind direction analyzed. Exposure B: urban and suburban areas with numerous closely spaced obstructions ≥ 9 m height; Kz = 0.70 at 4.5 m height. This is the least conservative exposure — applicable to suburban rooftop installations with surrounding buildings providing wind shielding. Exposure C: open terrain with scattered obstructions generally below 9 m — the governing category for the majority of utility-scale ground-mount solar installations in agricultural and rural settings; Kz = 0.85 at 4.5 m height. Exposure D: flat, unobstructed terrain within 1.6 km of large bodies of water (oceans, lakes, bays); Kz = 1.03 at 4.5 m height. The critical engineering discipline is that exposure category must be verified from site-specific upwind terrain analysis — not assumed based on nominal land use designation. A solar project in a rural “farmland” setting surrounded by open water on the prevailing wind direction must be analyzed as Exposure D for that wind direction, regardless of the nominal agricultural classification. The geographic and terrain analysis methodology for site-specific atmospheric and wind classification — including GIS-based upwind terrain analysis and regional wind speed map extraction — is provided in the regional climate design guide.
Engineering Variable Comparison Table
| Design Variable | Sensitivity to Wind Demand | Governing Structural Impact | Design Response | Cost Impact |
|---|---|---|---|---|
| Design Wind Speed (Vult) | Very High — qh scales with V²; 10% speed increase = 21% pressure increase; 20% increase = 44% increase | Pile uplift demand; rail bending; connection shear capacity at column base | Increase pile embedment depth; upgrade rail section thickness; verify all connection bolt shear capacities at elevated demand | High — V = 150 mph versus V = 120 mph requires approximately 56% greater uplift capacity at pile; embedment depth increase adds $0.008–$0.018/W to foundation cost |
| Terrain / Exposure Category | High — Exposure D produces 47% higher qh than Exposure B at equal wind speed; single largest correctable error in solar wind calculations | Velocity pressure qh amplification; affects all downstream pressure, uplift, and force calculations | Conduct site-specific upwind terrain analysis; do not assume Exposure B for rural sites; verify exposure for the governing wind direction (typically prevailing wind or maximum speed direction) | Medium — exposure upgrade from B to C at equal wind speed adds 21% to all wind demand; exposure upgrade from C to D adds 21% further; structural response adds $0.005–$0.015/W |
| Structure Height (h) | Medium — Kz increases with height; tracker stow height and post extension height affect velocity pressure and overturning moment arm simultaneously | Overturning moment at column base scales with both qh (height-dependent) and moment arm (height-proportional); moment scales approximately with h² | Minimize above-grade structural height where compatible with row-to-row shading requirements; specify column base connection capacity verified at the maximum tracker height including service extension | Medium — 0.5 m post height increase in open terrain adds approximately 12–18% to overturning moment demand; connection upgrade cost $0.003–$0.008/W |
| Panel Tilt Angle | High — CN (net pressure coefficient) is strongly tilt-dependent per ASCE 7-22 Fig. 29.4-7; uplift peaks at 20–35° tilt and reduces significantly below 10° and above 45° | Panel uplift force; torsional demand on tracker torque tube at non-stow positions; load combination interactions with snow at steep tilt | For fixed tilt: verify CN at the design tilt angle from ASCE 7-22 Fig. 29.4-7 for both interior and edge panels; for trackers: verify CN at all tracking positions including fault-stow worst-case angle | Medium — tilt optimization that reduces CN can reduce wind demand; interaction with energy yield requires tilt angle analysis from the tilt angle optimization resource before tilt reduction is accepted as a wind mitigation strategy |
| Array Edge vs Interior Panel Position | High — edge and corner panels experience CN 30–80% higher than interior panels per ASCE 7-22 Fig. 29.4-7; the highest uplift demand in the array is at the perimeter row and end bays | Perimeter piles require greater embedment depth than interior piles; end-bay bracing and connection hardware require upgrade relative to standard interior-bay specification | Specify perimeter pile embedment independently from interior pile embedment; verify end-bay connection hardware at the higher perimeter CN value; document separately in structural calculation package | Medium — perimeter pile upgrade (deeper embedment or larger section) adds approximately $0.003–$0.006/W to project cost; omitting the perimeter upgrade is the single most common wind load underspecification in utility-scale permit submissions |
Engineering Calculation Insight: Uplift Force at 130 mph Design Wind
The following worked example demonstrates the complete ASCE 7-22 wind uplift calculation for a utility-scale fixed-tilt ground-mount installation, from wind speed input to pile head uplift demand.
Design inputs: Vult = 130 mph; Exposure Category C; site elevation 200 m (Ke = 0.98); flat terrain (Kzt = 1.0); panel height h = 3.5 m; Kz at h = 3.5 m, Exposure C = 0.83; Kd = 0.85; tilt angle = 25°; post spacing = 2.5 m; panel dimension = 2.1 × 1.1 m; edge-of-array location (CN = −1.25 per ASCE 7-22 Fig. 29.4-7, clear wind flow, 25° tilt, edge panel).
Step 1 — Velocity pressure:
\[ q_h = 0.00256 \times 0.83 \times 1.0 \times 0.98 \times 0.85 \times 130^2 = 30.7 \ \text{psf} = 1.47 \ \text{kPa} \]
Step 2 — Design wind pressure (uplift, edge panel):
\[ p = q_h \times G \times C_N = 1.47 \times 0.85 \times (-1.25) = -1.56 \ \text{kPa (uplift)} \]
Step 3 — Net uplift force per pile (tributary area = 2.1 × 2.5/2 = 2.625 m², component of uplift normal to surface converted to vertical):
\[ F_{\text{uplift,factored}} = 1.6 \times 1.56 \times 2.625 \times \cos(25°) = 5.94 \ \text{kN} \]
Step 4 — Net pile tension demand (subtract dead load): Structural dead load per pile = 0.9 × 1.1 kN = 0.99 kN (LRFD 0.9D combination for maximum net uplift). Net pile tension = 5.94 − 0.99 = 4.95 kN at this single edge pile position. For the 150 mph case, qh scales as (150/130)² = 1.33×, producing Fuplift,factored = 7.90 kN and net tension = 6.91 kN — 40% higher demand from a 15% wind speed increase, driven by the V² relationship. This calculation demonstrates why wind speed map accuracy is structurally critical: a 15 mph underestimate of design wind speed increases pile tension demand by 40%, potentially pushing a marginally specified foundation below structural adequacy. The panel tilt angle that optimizes energy yield while minimizing wind pressure coefficient — and the structural trade-off between these objectives — is addressed in the tilt angle optimization resource.
Real Engineering Case: Pile Uplift Failure at Texas Coastal Site
Project Profile
Location: Matagorda County, Texas (Gulf Coast, 3.2 km from Matagorda Bay; prevailing wind from SSE over open water) | ASCE 7-22 Wind Speed: Vult = 140 mph (ASCE 7-22 Fig. 26.5-1D, Risk Category II; Gulf Coast contour) | Exposure Category: Originally specified as Exposure B (inland default); structural review at permitting stage identified prevailing wind direction as Exposure D (open water fetch of 4.8 km to the south) — raising Kz from 0.70 to 1.03 at array height and increasing qh by 47% | System: 35 MWp fixed-tilt ground-mounted installation at 30° tilt — for the full structural engineering methodology for utility-scale ground-mounted solar mounting systems in high-wind coastal environments | Original Foundation Specification: 100 mm square H-pile, 1.8 m embedment in medium-dense sand (N = 20–25 SPT), HDG to ISO 1461 — specified for Exposure B, V = 140 mph.
Engineering Challenge
Independent structural review during permit processing identified the Exposure B assumption as non-conservative for the SSE prevailing wind direction: the 4.8 km open-water fetch to Matagorda Bay classified the SSE approach as Exposure D per ASCE 7-22 Section 26.7. Recalculating with Kz = 1.03 (Exposure D) versus Kz = 0.70 (Exposure B) increased qh from 21.5 psf to 31.6 psf — a 47% velocity pressure increase at equal wind speed. Factored pile uplift demand at perimeter array positions recalculated at 18.4 kN per pile versus the originally specified 12.5 kN. The original pile design — 100 mm H-pile at 1.8 m embedment in medium-dense sand — was assessed for uplift capacity per ASCE 7 Commentary and geotechnical standard practice: skin friction contribution to uplift resistance = 8.5 kN; end bearing (zero contribution in uplift for H-pile); structural pile capacity = 35 kN (adequate). Net uplift capacity: 8.5 kN. Net uplift demand: 18.4 kN − 1.1 kN dead load = 17.3 kN — a structural inadequacy of 2.0× at perimeter piles along the southern array edge. Interior pile positions were also found inadequate at 11.8 kN demand versus 8.5 kN capacity. The project was issued a permit suspension pending foundation redesign. The pile design framework governing embedment depth, soil friction contribution, and foundation-to-structure force transfer is documented in the pile driven foundation engineering resource.
Structural Adjustment & Outcome
Foundation redesign addressed both the embedment adequacy and the exposure classification correction simultaneously: perimeter piles upgraded to 120 mm H-pile at 2.4 m embedment (skin friction capacity = 22.1 kN, providing 28% margin above 17.3 kN demand); interior piles retained at 100 mm H-pile with embedment increased from 1.8 m to 2.2 m (skin friction capacity = 11.8 kN, meeting the 11.8 kN interior demand at unity); horizontal cross-bracing added at end bays and at every fifth interior bay to distribute lateral wind load and reduce individual pile lateral demand by 35%. The combined redesign increased total foundation cost by $0.014/W DC. The project was permitted and constructed with the revised foundation specification. At the first major wind event post-commissioning — Hurricane Beryl remnant wind event, July 2024, peak gust recorded at 112 mph at the project site — zero pile movements were recorded; O&M inspection confirmed no foundation distress at any of the 14,200 pile positions.
Failure Risks & Common Engineering Mistakes
Underestimating Exposure Category
Exposure Category misclassification is the single most consequential input error in solar mounting wind load calculation — because every downstream calculation (velocity pressure, design pressure, pile demand, connection capacity) inherits the error with full magnitude. Defaulting to Exposure B for rural and agricultural sites without wind-direction-specific upwind terrain analysis is a systematic error documented in permit rejections across multiple U.S. states. The correct methodology: identify the two 45° upwind sectors for each wind direction analyzed (per ASCE 7-22 Section 26.7.1), classify each sector independently using aerial imagery, and assign the more conservative (higher exposure) category as the governing case. For projects within 5 km of coastlines, large lakes, or open reservoirs, Exposure D must be verified for the offshore wind direction — a directional analysis that is mandatory under ASCE 7-22 and cannot be avoided by averaging with inland exposure sectors.
Ignoring Load Combinations
Wind does not act alone on solar mounting structures — ASCE 7-22 LRFD requires evaluation of 1.2D + 1.6W (wind governs, typical for uplift), 0.9D + 1.6W (minimum dead load + maximum wind, governing for net pile tension), 1.2D + 1.0W + 1.0S (combined wind and snow, governing in northern mixed-climate sites), and 1.2D + 1.0E + 0.2S (seismic with concurrent snow, governing in SDC C–F sites). Single-load analysis that verifies wind uplift without the 0.9D factor on dead load systematically underestimates net pile tension demand — because using the full dead load as a counter to uplift is non-conservative; the minimum dead load case (0.9D) reduces the gravity offset and increases net pile tension by 10–20% compared to the full dead load case. All governing LRFD combinations must be checked; only the controlling combination governs the required structural capacity at each member and connection.
Insufficient Bracing or Thin Sections Under Wind Lateral Load
Wind lateral force — the horizontal component of wind pressure acting on the structural frame and pile above grade — must be resisted by the bracing system, not by individual column bending alone. An unbraced single-column H-pile projecting 1.5 m above grade under 30 psf lateral wind pressure from a 2.5 m tributary width carries a lateral shear of 30 × 0.00478 × 1.5 × 2.5 = 0.538 kips at pile head — creating a cantilever bending moment at grade of 0.808 kip·ft that must be resisted by the pile section modulus. At thin sections (100 mm H-pile, Z ≈ 38 cm³), bending stress = 0.808 × 12 / (38 × 0.0610) = 4.2 ksi — within yield, but with minimal reserve for combined axial plus bending interaction. Adding cross-bracing at every fifth bay reduces individual column lateral demand by 70–80%, eliminating the combined axial-plus-bending interaction as a governing limit state. Note that bracing and section capacity interact directly with coating integrity over the design life — a structurally adequate unbraced column at commissioning may fall below the bending interaction limit if corrosion-induced section loss reduces the effective section modulus by 15–20% by Year 20. The corrosion protection specification that must be integrated with structural wind design to maintain lifetime capacity is documented in the corrosion protection strategies resource.
System Integration Impact
Foundation Selection and Embedment Design
Wind load is the primary determinant of pile foundation type, section size, and embedment depth for ground-mount solar installations — and the engineering interaction between above-grade wind demand and below-grade soil resistance must be verified as a complete system, not as independent above-grade and below-grade designs. Pile uplift resistance in cohesionless soils is governed by skin friction (fs = K × σ’v × tan(δ)), which scales with embedment depth and soil density; in cohesive soils, unit adhesion (ca) governs and is soil-type specific. For sites where wind uplift demand exceeds the capacity of driven H-piles at practical embedment depths (typically 1.8–2.5 m), helical piers or ground screws with larger helix diameters provide a step-change increase in uplift capacity without requiring deeper excavation. The complete methodology for matching pile type and embedment specification to wind-derived pile head uplift demand — including soil bearing capacity factors by soil classification and N-value — is provided in the foundation selection guide, and the detailed design of driven H-pile and pipe pile sections for the specific wind demand cases documented in this guide is addressed in the pile driven foundation resource.
Snow Load Interaction
Wind and snow do not always produce independent governing load cases — in northern climates with moderate wind speed and high ground snow load, the combined ASCE 7-22 load combination 1.2D + 1.0W + 1.0S produces a higher bending demand on rails and columns than either wind or snow acting alone. Snow reduces the net uplift component (adding gravity load that partially offsets wind uplift) while simultaneously adding compression and bending to column and rail sections. The combined load interaction — and the section thickness specification that satisfies both wind and snow governing combinations simultaneously — is developed in the snow load considerations resource, which provides the load combination verification framework for mixed wind-snow design environments.
Seismic Response and Wind-Seismic Interaction
In seismic design categories C through F, ASCE 7-22 requires independent seismic load calculation and comparison with wind — the governing lateral load (wind or seismic) at each structural level determines the required lateral resistance design. In most utility-scale solar mounting structures, wind governs lateral load at low and moderate seismic zones (SDC A–C); seismic governs in SDC D–F when the structure’s effective weight (mass × PGA × R factors) produces a seismic base shear exceeding wind lateral force. The determination of which lateral load governs — and the structural detailing requirements specific to the governing case — is addressed in the seismic design resource, which provides the SDC-specific structural design provisions for solar mounting installations.
Engineering Decision Guide
When Wind Governs Structural Design:
- Site Vult ≥ 130 mph (per ASCE 7-22 Risk Category II wind maps) — wind load dominates all structural limit states in C and D exposure at this threshold and above
- ASCE 7 Exposure C or D — open terrain or coastal exposure amplifies velocity pressure 21–47% above Exposure B at equal design wind speed
- Single-axis tracker systems at any wind speed — torsional instability and fault-stow case wind loads require independent tracker wind analysis beyond standard fixed-tilt provisions
- Array perimeter and edge bay piles — CN at edges is 30–80% higher than interior; perimeter pile specification must be designed independently
- Low ground snow load (< 0.5 kPa) — wind-only or wind-dominant LRFD combination governs without snow contribution
- Site topographic amplification (Kzt > 1.0) — hilltop, ridge, or escarpment sites require topographic wind speed amplification per ASCE 7-22 Section 26.8
When Snow or Seismic May Govern Instead:
- High ground snow load (Sg ≥ 2.0 kPa) in low-wind inland region (Vult ≤ 115 mph) — 1.2D + 1.6S combination may exceed wind case for rail bending
- SDC D–F seismic zones with heavy structural mass — 1.2D + 1.0E combination may exceed wind lateral case for pile lateral force
- Short-span rooftop systems in suburban Exposure B — wind demand is lowest; snow governs in northern climates
Cost & Lifecycle Impact
| Wind Design Strategy & Environment | Incremental Structural Cost vs Baseline | Foundation Cost Impact | O&M Inspection Requirement | 25-Year Structural Risk |
|---|---|---|---|---|
| Exposure B correctly classified (V = 120 mph, inland suburban) | Baseline (standard utility specification) | Standard H-pile 1.8 m embedment | Biennial structural inspection; wind event post-inspection | Very Low — correctly specified for actual exposure |
| Exposure B misclassified (actual Exposure C, V = 120 mph) | None (underspecified at procurement) | Standard pile — inadequate for actual exposure | Emergency inspection after first major wind event | High — pile uplift failure risk in 700-yr return period wind event; emergency remediation $0.012–$0.025/W |
| Exposure C correctly classified (V = 130 mph, rural open terrain) | +$0.006–$0.012/W (pile upgrade, section upgrade) | H-pile 2.0–2.2 m or larger section | Biennial; post-major-wind-event inspection after events > V/2 | Low — verified for actual design demand |
| Exposure D correctly classified (V = 140 mph, coastal) | +$0.014–$0.022/W (foundation, bracing, section upgrades) | H-pile 2.4 m or helical pier; cross-bracing at end bays | Annual inspection; semi-annual at fasteners (C5 corrosion) | Very Low — designed to governing coastal demand with verification margins |
| Exposure D with stow strategy failure (tracker misspecification) | None (misspecification, not upgrade cost) | Standard foundation undersized for fault-stow angle | Emergency response after tracker controller fault event | Very High — tracker structural collapse risk if fault-stow wind case not verified; repair/replacement $0.08–$0.15/W per affected bay |
Wind load structural upgrade cost forms part of the total project capital cost per watt — the complete cost benchmarking framework disaggregated by wind region, foundation type, and structural system specification is provided in the solar mounting cost per watt analysis resource.
Related Engineering Topics
Frequently Asked Questions
How is wind load calculated for solar mounting systems per ASCE 7-22?
ASCE 7-22 wind load calculation for ground-mount solar follows a four-step chain: (1) extract Vult from ASCE 7-22 Figure 26.5-1D wind speed maps for the project location and Risk Category II; (2) calculate velocity pressure qh = 0.00256 × Kz × Kzt × Ke × Kd × V² at the array reference height, using exposure-specific Kz; (3) obtain net pressure coefficient CN from ASCE 7-22 Figure 29.4-7 for the design tilt angle and panel position (interior, edge, or corner); (4) calculate design pressure p = qh × G × CN and multiply by tributary area to obtain force at each structural connection. All four steps must be documented with ASCE 7-22 section references in the structural calculation package for permit submission.
What design wind speed should I use for a utility-scale solar project?
Design wind speed must be extracted from ASCE 7-22 Figure 26.5-1D (for Risk Category II structures) at the specific project location — it cannot be assumed from regional averages or neighboring project data. In the continental U.S., Vult ranges from 110 mph (Pacific Northwest, inland Great Plains) to 165 mph (South Florida Atlantic coast) for Risk Category II. The governing wind direction is not always the prevailing wind direction — maximum Vult and the Exposure D approach (if applicable) may come from different compass sectors; both must be evaluated and the most demanding combination selected as the design case.
Is ASCE 7 mandatory for solar mounting structural design?
ASCE 7-22 is mandatory wherever the 2024 IBC has been adopted by the AHJ — which covers the majority of U.S. states and is the reference standard in most U.S. solar permit submissions. Jurisdictions still on IBC 2021 require ASCE 7-16; the ground-mount Section 29.4.5 was new in ASCE 7-22, so ASCE 7-16 projects use the open building monoslope adaptation from Chapter 27. Internationally, Eurocode 1 (EN 1991-1-4) governs in EU countries; national standards (GB 50009 in China, IS 875 in India) apply in their respective markets. In all cases, the local code adoption status must be confirmed with the AHJ before the structural calculation methodology is finalized.
How does wind uplift affect solar pile foundations specifically?
Wind uplift places piles in net tension — the opposite of the compression loading that governs most civil foundation design. Pile compression capacity (end bearing + skin friction in compression) is not directly transferable to pile tension capacity: end bearing contributes zero to uplift resistance; only skin friction (upward soil-to-pile adhesion) and pile self-weight resist extraction. In granular soils, tension skin friction is typically 50–80% of compression skin friction, meaning a pile that carries 50 kN in compression may only resist 25–40 kN in uplift tension — a reversal capacity ratio that must be explicitly verified for the governing wind uplift demand, not inferred from the compression capacity.
Can corrosion reduce a solar mounting structure’s wind resistance over time?
Yes — and this is a structurally confirmed interaction, not a theoretical concern. At C4 atmospheric classification, zinc coating depletion exposes bare steel pile shafts at Year 8–14, after which steel corrosion at 50–120 µm/yr reduces the pile section modulus and connection net section area over the remaining design life. A column at 80% of original section modulus at Year 20 has 80% of its original wind bending capacity — which may be adequate for the design wind demand if the original specification included structural margin, but inadequate if the section was specified at unity. The wind resistance reduction from corrosion-induced section loss must be incorporated as a maintenance sensitivity parameter in the structural design brief, with inspection thresholds that trigger remediation before the critical capacity limit is reached.
Engineering Summary
- Wind load is the governing structural demand in the majority of solar mounting designs — at open terrain sites (Exposure C and D), wind uplift at array perimeters exceeds structural dead load by 3–8×, meaning the pile foundation in tension, not the above-grade structure in bending, is the critical load-path element that governs structural adequacy under design wind events
- The V² relationship makes wind speed accuracy the highest-leverage input in structural design — a 15% wind speed underestimate (115 mph assumed vs. 130 mph actual) increases pile uplift demand by 27% and may convert a barely-adequate foundation specification to a structurally deficient one; wind speed maps must be read at the specific project location, not approximated from regional benchmarks
- Exposure category classification is the most consequential and most frequently underspecified input — upgrading from Exposure B to Exposure C increases velocity pressure by 21%, and from Exposure B to Exposure D by 47%, at equal wind speed; open-terrain and coastal sites within 1.6 km of water bodies must be analyzed directionally with independent classification by wind sector, per ASCE 7-22 Section 26.7
- Wind engineering requires integrated structural design — not isolated member checking — pile foundation, above-grade steel section, connection hardware, bracing system, and coating specification must form a verified load path from panel surface to soil resistance; every link in this chain must be designed for the same governing wind demand, and the weakest link — not the average — determines the system’s structural adequacy under the design event
From Wind Load Number to a Manufactured Solution
Verdict: Calculate the ASCE 7 design pressure and uplift for your site, then hand that figure to a racking manufacturer to size posts, rails and foundations — under-sizing risks collapse, over-sizing wastes steel and cost. The indicative table maps a calculated design wind pressure band to the structural response a supplier will engineer.
| Design Wind Pressure (indicative) | Typical Structural Response | Cost Impact |
|---|---|---|
| Low (< 1.0 kPa) | Standard post/rail gauges, wider pile spacing | Baseline |
| Moderate (1.0–2.0 kPa) | Heavier sections, added bracing, closer piles | + moderate steel |
| High (> 2.0 kPa / coastal) | Reinforced frames, deeper embedment, HDG | + significant steel & foundation |
Bands are indicative; your stamped calculation governs. Once you have a design pressure, see wind load standards for the governing code and material thickness & strength for section sizing. PVRack will take your wind number and return a custom-engineered racking quote.
Prepare for project-specific review
Use this guide to organize the site, load, system and compliance inputs that a product supplier, licensed engineer, installer or local authority will need. PVRack does not provide project-specific engineering approval or supplier quotations.